Last week you analysed neuron firing with numpy
In the lab we found that numpy is much faster than a list and a for loop. Numpy is powerful and useful to analyse large numerical series.
The array numpy introduced became the shape of scientific computing — pandas, scipy and scikit-learn all sit on top of it. PyTorch took the same idea and put it on GPUs, and that is the machinery modern AI is built from, ChatGPT and Claude included.
An array holds one kind of thing. Today a row reads August, Hoggs, Rbean, 140, 0, 1 — words and numbers together, every column meaning something different.
numpy has no answer to that. pandas does.
Nine allotments in Brighton
Two summers, 1,620 surveys, 18 crops, six Bombus species — counted flower by flower. One row = one survey.
| Month | Allotment | Crop | Flowers | Honeybees | Bumblebees |
|---|---|---|---|---|---|
| August | Hoggs | Bbean | 350 | 0 | 1 |
| June | Hoggs | Bbean | 100 | 0 | 1 |
| August | Hoggs | Squash | 6 | 5 | 0 |
| August | Hoggs | Squash | 8 | 5 | 1 |
| August | Hoggs | Raspberry | 60 | 1 | 2 |
Words on the left, numbers on the right — the shape numpy could not hold. (Bbean = broad bean, Rbean = runner bean.)
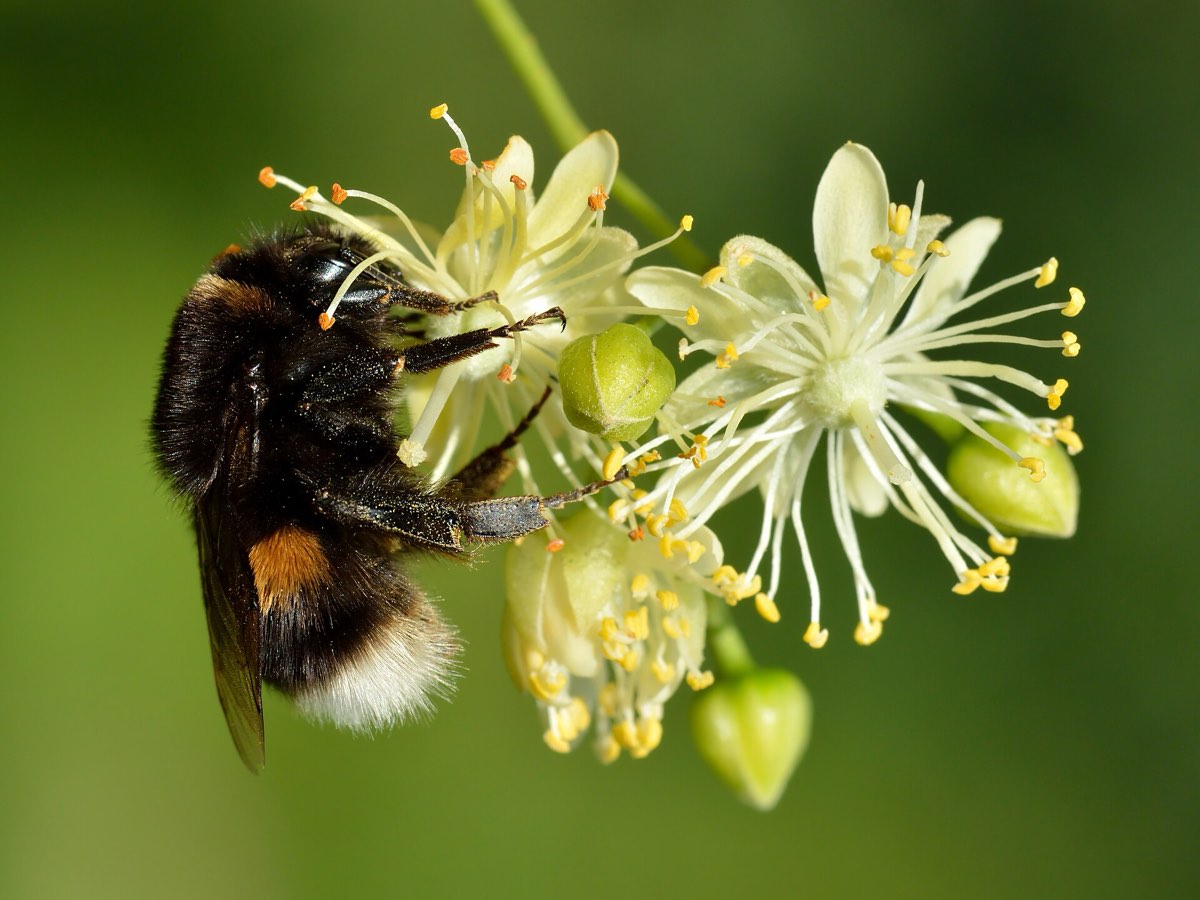
If the bumblebees vanished, what would you lose?
Nicholls, Griffiths-Lee, Basu, Chatterjee & Goulson (2022), Plants People Planet — collected about two miles from this room.
Two kinds of bee, one flower
Each survey counts who visited a patch of flowers. Two columns matter today: Honeybees and Bumblebees. Both are bees, both carry pollen — but they are very different animals.
One species, mostly kept by beekeepers: livestock, in hives of tens of thousands. If a colony dies, the beekeeper replaces it.
About two dozen wild species in the UK, six in our data. Small nests in the ground and hedges. Big and hairy: they fly in cold, wet weather, and their tongues come in different lengths — so they suit different flowers.
Wild bumblebees are declining: lost meadows and hedges, pesticides, disease, a warming climate. The short-haired bumblebee was last seen in Britain in 1988. No beekeeper can restock them.
bee visits = honeybee visits + bumblebee visits
Take the bumblebees away and the honeybees are still there. A crop both of them visit would cope. A crop that mostly relies on bumblebees would be left with almost no bees at all.
Place your bet
The bumblebees vanish; the honeybees stay. Which crop would be left with almost no bee visits? Go with your gut — by the end of the hour, pandas will tell us who was right.
RaspberrySquashBroad beanAppleBlackberryRemember what you picked. Watch for clues on the way — the data settles it at the end.
This session — one question, five steps
One question, answered with pandas from start to finish. The rest of pandas is for the lab.
Open the file and meet two receptions — the table and its columns — then go looking for trouble in the data.
Five steps, one pandas method each, from the raw table to the crop that would lose its bees. Run each one, then fix a broken copy.
Your votes from the start, now with the answer.
Everything else pandas can do, tried on the same survey at your own pace.
You won't remember every method — nobody does. The cheat sheet at the end is for practising later.
The DataFrame and its columns
Working with messy tabular data of varied types, the reality of biology data...
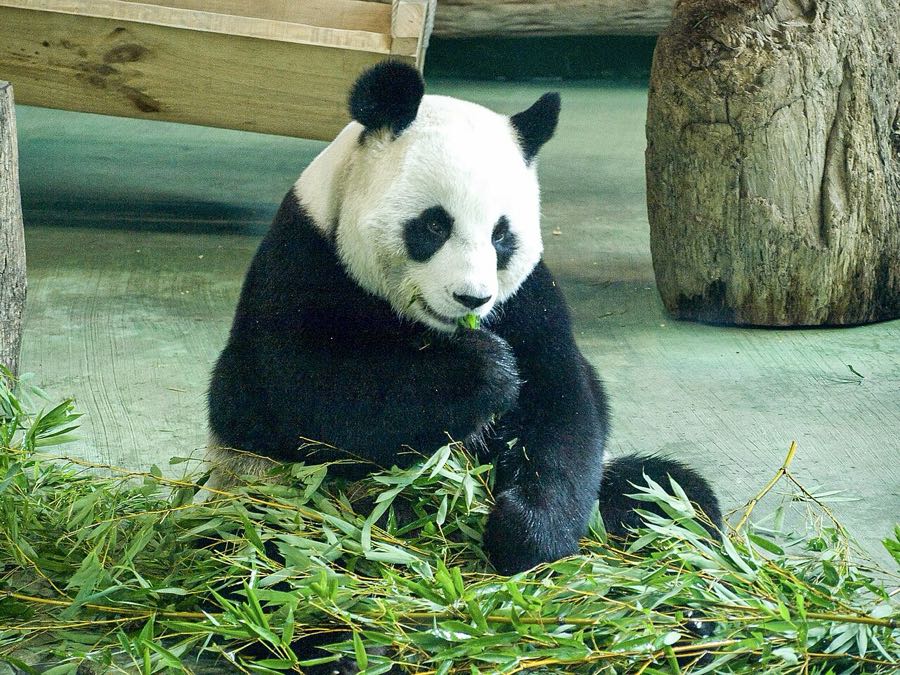
KQuhen, Wikimedia Commons, CC BY-SA 4.0
One line to open the file
Real data comes as CSV or Excel files. pandas reads the header row, works out a type for every column, and hands you a DataFrame — a table with its own analysis methods.
np.loadtxt(path, delimiter=",", skiprows=1, usecols=1)
Say the separator, skip the header, and give the column number. Mixed text and numbers? An error.
pd.read_csv(path)
Reads the header itself, names every column, and picks a type per column. Then .head() shows the first five rows.
The DataFrame's reception
Last week: an object is a hotel, and you only ever talk to its reception. The DataFrame is the main reception you will work with today.
df.shape: 1,620 rows, 13 columns. df.dtypes: the type of every column.
df.head(), df.describe(), df.sort_values() — jobs the table does for you.
An array has one type for everything. A DataFrame has one type per column: text where there is text, integers where there are counts.
What a DataFrame can do
A taste of the menu at the table's reception. You don't learn it; you look it up.
- .shaperows, columns
- .columnsthe column names
- .dtypestype of each column
- .indexthe row labels
- .head() .tail()first / last rows
- .sample()random rows
- .describe()summary of every number column
- .info()types and missing values
- df["col"]one column
- .loc[ ]rows and columns by name
- .iloc[ ]rows and columns by position
- .drop()leave some out
- .sort_values()sort by a column
- .rename()new column names
- .dropna() .fillna()deal with gaps
- .drop_duplicates()remove repeated rows
- .sum() .mean()down every column
- .count()values per column
- .groupby()one answer per group
- .corr()which columns move together
- .merge()join two tables
- .plot()a quick chart
- .to_csv()write a CSV file
- .to_excel()write a spreadsheet
…and about 200 more. The full menu: pandas.pydata.org → DataFrame
Each column has its own reception: a Series
Ask the table for one column and you get the second type of the day — a numpy array that remembers its own name.
.name and .dtype — a column knows what it is called and what it holds. One type, like an array.
.sum(), .mean(), .max(), and a mask counted by summing its Trues — all last week's numpy.
548 bumblebees in 1,620 surveys, and only 311 surveys saw any. Most saw none at all — remember that when you start averaging.
What a Series can do
Everything numpy did, plus jobs for columns of words: counting categories, finding the distinct values, working on text.
- .namethe column name
- .dtypewhat it holds
- .sizehow many values
- .is_uniqueany repeats?
- .sum() .mean()total, average
- .median() .std()middle, spread
- .min() .max()smallest, largest
- .describe()all of them at once
- .idxmax()label of the largest
- .nlargest()the top n
- .between()inside a range?
- .isin()one of these values?
- .value_counts()how often each value
- .unique()the distinct values
- .nunique()how many distinct
- .str.lower()text methods, every row
- .sort_values()in order
- .round()round every value
- .map()swap values for others
- .isna()which are missing?
- .to_numpy()the plain array
- .to_list()a Python list
- .plot()a quick chart
- .to_frame()back to a table
…and about 200 more. The full menu: pandas.pydata.org → Series
Two odd things are hiding in here
Now use the Series menu on the real data. Before any analysis, go looking for trouble: run the first line, then uncomment the second. Spot something odd? Say so — or at least think it loudly.
Odd thing 1.describe() — read the maxclick to reveal
Flowers = open flowers on the watched patch. Typical patch: 25 (the 50% row). Max: 2,000 — a fruit tree in blossom. And the big values are all round: 500, 800, 1,000. Nobody counted those; they are guesses.
Odd thing 2value_counts() on Allotmentclick to reveal
Weald was surveyed 495 times, Camp_Site twice. Any total for Camp_Site means nothing. Remember this one — it matters at the end.
The DataFrame, one question at a time
Same table as on the slides. Pick the line that does the job.
import pandas as pd

df = pd.read_csv("pollinators_lecture.csv")
# 1,620 surveys (rows), 13 columnsStep 1 — Its shape
What does df.shape give you?
df = pd.read_csv("pollinators_lecture.csv") # 1,620 surveys, 13 columns1620(13, 1620)(1620, 13)[1620, 13]Step 2 — One column
Which line gives you the Bumblebees column as a Series?
df = pd.read_csv("pollinators_lecture.csv")df[["Bumblebees"]]df["Bumblebees"]df("Bumblebees")df.Bumblebees()Step 3 — Count with a mask
How many surveys saw at least one bumblebee? Which line tells you?
df = pd.read_csv("pollinators_lecture.csv")df["Bumblebees"].sum()df["Bumblebees"].count()len(df["Bumblebees"])(df["Bumblebees"] > 0).sum()Revision — interrogate the table
Try this after the lecture. One column at a time — every method is one you used on arrays last week.
The road to the answer
Five steps, one method each — and at the end, your bet.
The map: five steps to the answer
"If the bumblebees vanished, which crop would lose its bees?" is too big for one line. Break it into questions pandas can answer one at a time.
1Who visits one crop?
rasp = df[df["Crop"] == "Raspberry"]2…and every crop at once?
visits = df.groupby("Crop")[["Honeybees", "Bumblebees"]].sum()3What share is bumblebee?
visits["share"] = visits["Bumblebees"] / (visits["Honeybees"] + visits["Bumblebees"])4Which crop is top?
visits.sort_values("share", ascending=False)5Can we trust it?
enough = visits[visits["Bumblebees"] >= 20]
→ the crop that would lose its bees
Each step: what we want → the method → run it → read the result → fix a broken line.
Step 1 — who visits one crop?
df["Crop"] == "Raspberry" is a mask: 1,620 True/False. Inside df[ ] it keeps the rows where it is True. The result is a smaller DataFrame, so we can ask its columns again.
Raspberry has the most bumblebee visits — but 245 honeybee visits too. Lose the bumblebees and the honeybees are still there. And there are 17 more crops to check.
Fix step 1 — one crop
Should give the raspberry rows: KeyError. Run it, vote, fix it.
rasp = df[df["Crop"] == "Raspberry"]rasp = df["Crop"] = "Raspberry"rasp = df["Raspberry"]rasp = df[df["Crop"]] == "Raspberry"How groupby works
Three moves: split the rows into piles, apply a sum to each pile, combine the answers. Six real rows from the survey — click through.
df.groupby("Crop")[["Honeybees", "Bumblebees"]].sum()| Crop | Honey | Bumble |
|---|---|---|
| Bbean | 0 | 1 |
| Squash | 5 | 0 |
| Raspberry | 1 | 2 |
| Bbean | 0 | 1 |
| Squash | 5 | 1 |
| Raspberry | 2 | 2 |
| Bbean | 0 | 1 |
| Bbean | 0 | 1 |
| Raspberry | 1 | 2 |
| Raspberry | 2 | 2 |
| Squash | 5 | 0 |
| Squash | 5 | 1 |
| Bbean | 0 | 2 |
sum of 2 rows
| Raspberry | 3 | 4 |
sum of 2 rows
| Squash | 10 | 1 |
sum of 2 rows
visits
| Honey | Bumble | |
|---|---|---|
| Bbean | 0 | 2 |
| Raspberry | 3 | 4 |
| Squash | 10 | 1 |
the table
split
apply
combine
Six rows, crops mixed up.
Step 2 does exactly this, with 1,620 rows and 18 piles.
Step 2 — every crop at once
.groupby("Crop") sorts the rows into one pile per crop. Pick the two columns, .sum() each pile: one row per crop.
Eighteen crops, each with its two totals. The crop names are now the row labels. Look down the list — does any crop look different?
Two columns are a list: [["Honeybees", "Bumblebees"]]. Outer brackets pick, inner ones make the list.
Fix step 2 — every crop
Should give one row per crop: ValueError. Run it, vote, fix it.
visits = df.groupby["Crop"][["Honeybees", "Bumblebees"]].sum()visits = df.groupby(Crop)[["Honeybees", "Bumblebees"]].sum()visits = df.groupby("Crop")[["Honeybees", "Bumblebees"]].sum()visits = df["Crop"].groupby()[["Honeybees", "Bumblebees"]].sum()Step 3 — what fraction are bumblebees?
Assign to a column name that doesn't exist yet and pandas makes it. The sum runs down every row at once — last week's numpy, with names.
The share is the question that matters: 0.92 means 92 of every 100 bee visits are bumblebees. Take them away and only 8 are left. A big share is a big loss.
Fix step 3 — the share
No error, but a share can’t be above 1. Run it, vote, fix it.
visits.share = visits["Bumblebees"] / (visits["Honeybees"] + visits["Bumblebees"])visits["share"] = visits["Bumblebees"] / (visits["Honeybees"] + visits["Bumblebees"])visits["share"] == visits["Bumblebees"] / (visits["Honeybees"] + visits["Bumblebees"])share = visits["Bumblebees"] / visits["Honeybees"] + visits["Bumblebees"]Step 4 — which crop is top?
.sort_values("share") orders the rows by one column, smallest first. ascending=False turns it round.
Strawberry and blueberry: 100% bumblebees! From one bee each. Odd thing 2 from Part 1 is back — a number built on almost no data means nothing.
Fix step 4 — the top
No error, but the list is upside down. Run it, vote, fix it.
print(visits.sort_values().head())print(visits["share"].sort().head())print(visits.sort_values("share").tail(1))print(visits.sort_values("share", ascending=False).head())Step 5 — can we trust it?
Step 1's mask again, this time on the crop table: keep only crops with at least 20 bumblebee visits, then sort.
Run it, read the top row → clickBroad bean — 92%
23 bumblebee visits, 2 from honeybees. Take the bumblebees away and almost nothing is left. Raspberry has the most bumblebees, but its 245 honeybees would carry on.
Fix step 5 — enough data
No error, but where is the table? Run it, vote, fix it.
enough = visits[visits["Bumblebees"] => 20]enough = visits["Bumblebees" >= 20]enough = visits[visits["Bumblebees"] >= 20]enough = visits.loc["Bumblebees" >= 20]How did your bet do?
The same poll as at the start of the lecture — your votes, now with the answer.
RaspberrySquashBroad beanAppleBlackberryMost money usually goes on raspberry: the biggest number in the table. The answer was the biggest share. Picking the right question is half of data analysis.
In the Lab — what would you lose?
Today gave you a first answer. The lab tests whether it holds up — same file, the same tools, put together.
- ✓
Bumblebee share of each crop’s visits — done together today
groupby, a new column, filter, sort
- 1
Make it fair: visits per survey, per flower
new columns, .mean()
- 2
Is broad bean’s 92% solid? It rests on 25 visits
groupby(...).size(), filter
- 3
Which bumblebee species carry the broad beans?
the six species columns
- 4
Does the answer change from month to month?
groupby(["Month", "Crop"])
The catch to watch for: a crop surveyed 269 times will always have the biggest totals. Compare like with like — per survey, or per flower — before you crown a winner.
The pandas cheat sheet
Everything from today, and a few relatives. Practise them on df in the revision slides — this is the list for later.
- pd.read_csv("file.csv")file → DataFrame
- df.head(10) / df.tail()first / last rows
- df.shape · df.columnssize · column names
- df.info() · df.dtypestypes, missing values
- df.describe()summary of number columns
- df["Crop"]one column → Series
- df[["Crop", "Flowers"]]several → DataFrame
- df.loc[mask, ["Crop"]]rows and columns
- df.loc[588]one row, by its label
- df[df["Flowers"] > 100]rows where True
- df[(a) & (b)] · df[(a) | (b)]both · either
- df[df["Crop"].isin([...])]one of a list
- df[~mask]everything else
- df.sort_values("Flowers", ascending=False)biggest first
- df.nlargest(5, "Honeybees")top five
- df["Crop"].value_counts()tally a text column
- df["Crop"].unique() · .nunique()the values · how many
- df["Total"] = df["A"] + df["B"]a new column
- df.groupby("Month")["Bumblebees"].sum()one answer per group
- .mean() · .max() · .count()other things to do per group
- s.sort_values(ascending=False)rank the answer
- s.sum() · s.mean() · s.median()one number
- s.min() · s.max() · s.std()spread
- (s > 0).sum()count with a mask
- s.idxmax()label of the biggest
s is any one column, e.g. s = df["Bumblebees"]. Full docs: pandas.pydata.org → User Guide.
What you can do now
Two ideas and five moves — enough to take a raw survey to an answer.
The rest of pandas — .loc, .iloc, value_counts, & and | — and real files that fight back: missing values, and a column named "Hortorum " with a trailing space, so asking for it raises a KeyError.
Next lecture: making these tables into figures people can read.
Keep going with pandas
You learn pandas by using it. Pick one thing from the left column and do a little each week.
- Pandas Workout ↗
Reuven Lerner (Manning). 200 exercises on real data sets — the lab, times ten.
- Data Manipulation with pandas ↗
DataCamp. Filtering, groupby and more, in short browser exercises — our parallel course.
- Kaggle Learn: Pandas ↗
Free, short, in the browser. A good evening’s revision.
- Python for Data Analysis, 3rd ed. ↗
Wes McKinney, who wrote pandas. Free to read online.
- Getting started tutorials ↗
The official docs, one question per page: “How do I select a subset of a table?”
- 10 minutes to pandas ↗
The whole library on one page, with examples.
- The official cheat sheet ↗
Two pages, worth printing.