You loaded a CSV, filtered it, grouped it, and got an answer out — all of it as numbers in a terminal.
read_csv, .groupby(), .mean() — enough to answer a real question.
Eighteen rows of numbers. You found the answer by scanning down a column with your finger.
Today the computer does the looking.
Some patterns are invisible in a table and obvious in a picture — the difference between finding a result and walking past it.
The data
DepMap
1,165 cancer cell lines, every gene switched off one at a time.
The question
Who needs SOX10?
Most cancer cells don't care when it is gone. Some die. Which ones?
The technique
Figures with matplotlib
One way of plotting, learned slowly and done properly.
1 · Grow the cells
1,165 cancer cell lines from 30 tissues: skin, lung, bowel, blood…
2 · Break one gene per cell
CRISPR: every cell gets a guide that knocks out one gene. Together the guides cover every gene.
3 · Let them grow
About three weeks. Cells that lost a gene they need die or grow slowly.
4 · Count the survivors
Sequence the guides. Guides for essential genes have gone missing.
The number: gene effect
Lower = more needed. depmap.org
Before any code: what kind of data you have decides which plot to draw, and how to show a difference: by position, colour, shape or size.
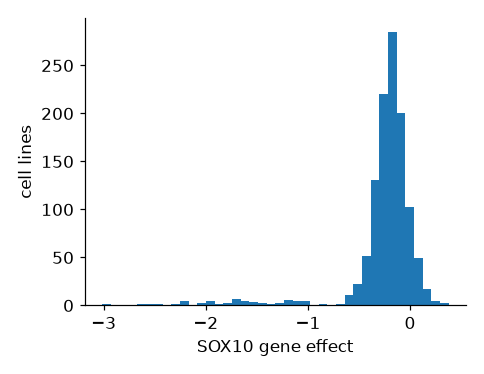
The gene SOX10 across all 1,165 cell lines, twice: as four numbers, and as a picture.
The mean says −0.27: a gene that barely matters. The picture says 93 cell lines genuinely need it — averaged away by a single number. Who are they? That is today's case.
Every column you will ever plot is one of two kinds. Work out which before you choose a plot: the plot follows from it.
Categorical
labels you can count
Examples: cancer lineage (Skin, Lung, Bowel…), cell line name, genotype (mutant / wild type), treatment
The test: Is “halfway between” meaningless? A lineage halfway between Skin and Lung does not exist.
On a figure: groups: one bar or box per category, one colour or shape per category
Continuous
numbers you measure
Examples: SOX10 gene effect, gene expression, doubling time, temperature
The test: Does every value in between make sense? A gene effect of −0.83 does.
On a figure: a position along an axis: histograms, scatter plots, the y-axis of a box plot
In DepMap: oncotree_lineage is categorical; every gene column is continuous.
Six methods cover almost everything you will need. Read them as answers to what kind of columns am I holding? — not as a menu.
ax.hist(x)ax.scatter(x, y)ax.plot(x, y)ax.bar(names, values)ax.boxplot(groups)ax.violinplot(groups)Continuous is measured on a scale: expression, a dependency score, time. Categorical is a label you can count: lineage, treatment, strain. That one distinction picks the row you need.
An aesthetic is a visual property you map to a column: where a mark sits, its colour, its shape, its size. Each one is a way to show a difference. In Part 2 you will see that each is also just an argument in the code.
x, ycolor=s=marker=linewidth=linestyle=They are not equal. The eye judges position most accurately, then length, then colour, then size, and shape worst of all. Spend position on what matters.
Every aesthetic can show a difference, but not every difference. Some suggest an order (size: bigger is more), others don't (shape: a triangle is not more than a circle).
Rule of thumb: the comparison that matters most goes on position. Colour comes next. Use shape and size sparingly, and check your colours still work for someone who is colour-blind.
No code to write: decide what kind of data you have, then pick the figure that shows the message best.
# DepMap: one row per cell line cell_line_name oncotree_lineage SOX10 BRAF RAN NIH:OVCAR-3 Ovary/Fallopian… -0.327 -0.331 -4.196 HEL Myeloid -0.137 … …
Which of these columns is categorical?
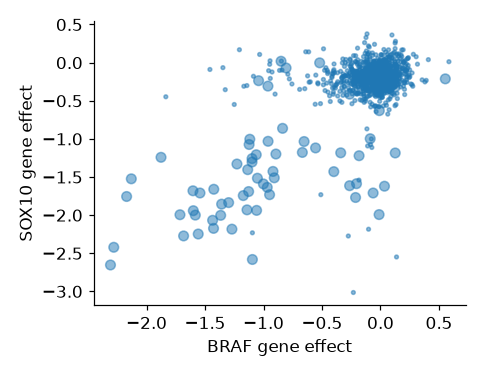
SOX10 dependency scoreCancer lineage — Skin, Lung, Bowel…Cell doubling time, in hoursGene expression, in TPMThe message this figure should show: skin cancer lines need both BRAF and SOX10. Can you see it?
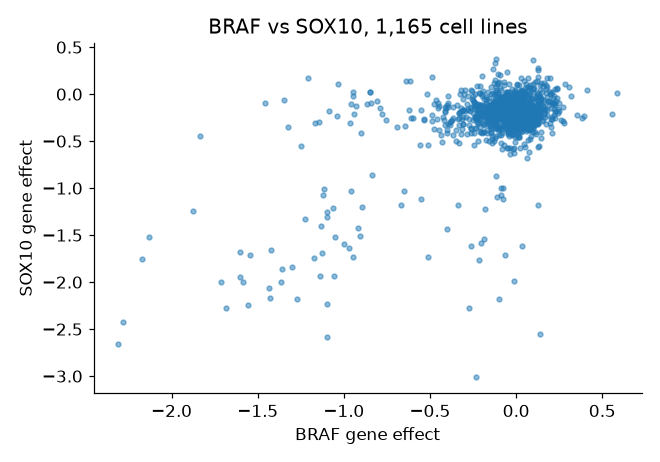
Every cell line is the same colour, so you can't tell which dots are skin cancer. What would you change?
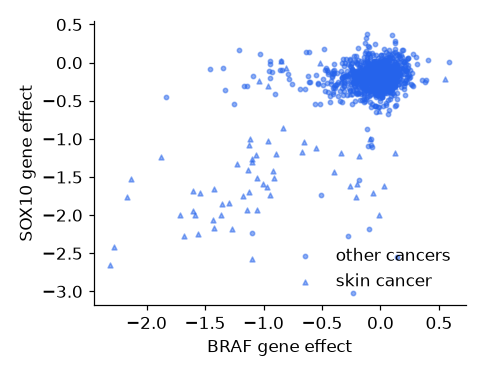
Four ways to fix it. Which gives the clearest message?
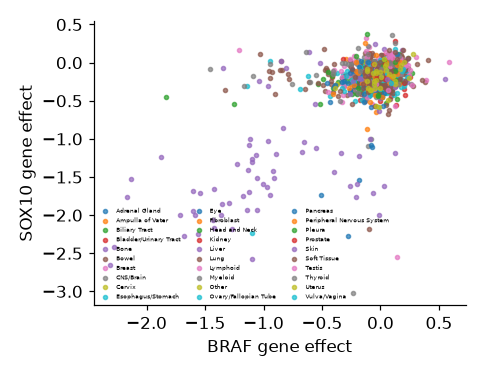


Every cancer type its own colourSkin cancer in colour, the rest greySkin cancer as bigger dotsSkin cancer as trianglesThe message this figure should show: skin cancer lines need SOX10 more than other cancers. Can you see it?

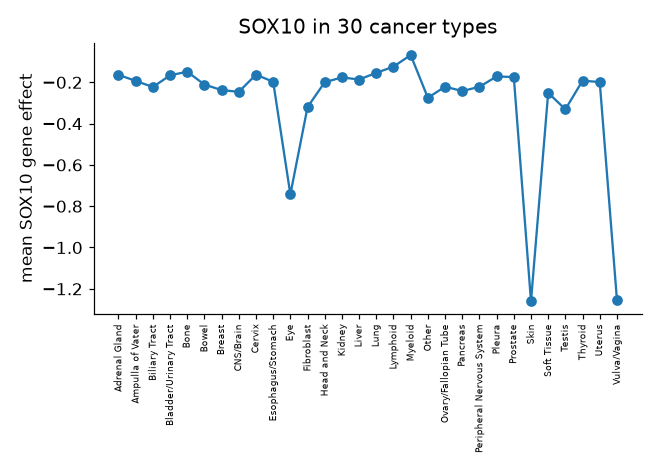
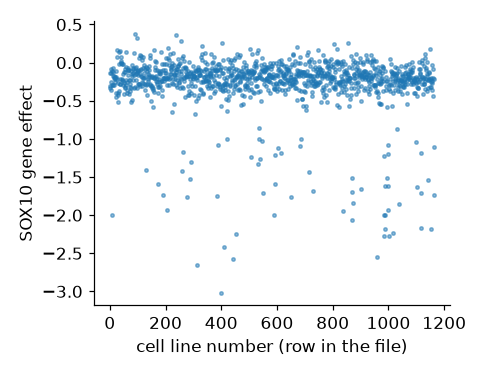
The line joins one cancer type to the next. Does "from Prostate to Skin" mean anything? What kind of data is on the x-axis?
Four ways to fix it. Which gives the clearest message?
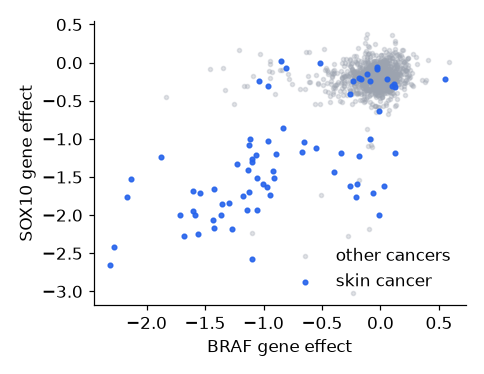


A histogram of all SOX10 valuesOne bar per cancer type, alphabeticalSkin vs all other cancers, box with dotsSOX10 against the row numberThe code behind every figure: make it, put data on it, label it. By the end you will have drawn the first clue in the SOX10 case.
Like the hotel in Lecture 5, you only talk to a reception. Every line of plotting code goes to one of three.

ax.one panel: draw and label it. Your main reception.
ax.scatter() ax.hist() ax.boxplot() ax.set_xlabel() ax.set_title() ax.legend()
fig.the whole figure, all its panels at once.
fig.set_size_inches() fig.suptitle() fig.tight_layout()
plt.the extras: make it, save it, show it.
plt.subplots() plt.savefig("fig.png") plt.show()
Three steps, three runs: run it, remove the # in front of step 2, run again, then step 3.
1 · An empty figure
plt.subplots() hands you the figure and one empty panel.
2 · Put the data on it
ax.plot(hours, cells): two lists of the same length, x first, then y.
3 · Label it
Each label is an ax.set_…() on the same panel. No labels, no result.
Every other plot type works the same way: swap ax.plot for ax.scatter, ax.hist or ax.boxplot; steps 1 and 3 stay the same. Looking for something an ax can do? Look here first: matplotlib.org/stable/api/axes_api.html
The same three steps, now on a DataFrame column. A histogram cuts the range of values into bins and counts how many cell lines fall into each: one bar per bin.
🔍 Clue 1. Most cell lines sit near 0: switching SOX10 off does nothing to them. But a long tail runs out to −3: about 90 cell lines die without it. Who are they?
Too few bins hide the tail; too many turn it into noise. There is no right number, only one that shows the shape.
The histogram you just made, taken apart. Each part belongs to the panel, so each is an ax.set_…() call; only the whole sheet is fig.
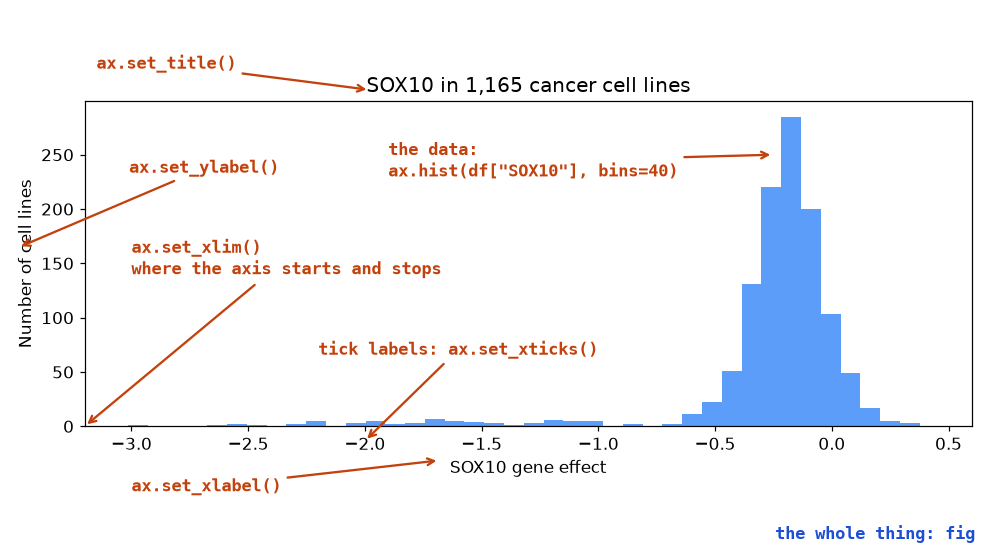
Can't remember the name? Type ax.set_ and let VS Code or Colab suggest the rest, or look it up in the Axes API.
Choose by the data you hold. The other two steps never change: make the figure, then label it.
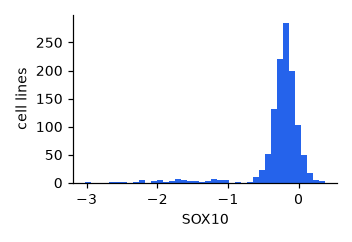
ax.hist(values, bins=40)
one continuous column
how SOX10 is spread across all cell lines
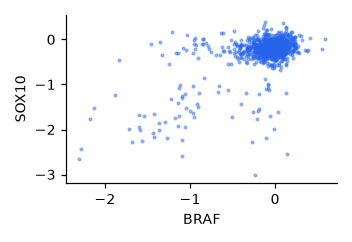
ax.scatter(x, y)
two continuous columns
BRAF against SOX10, one dot per cell line
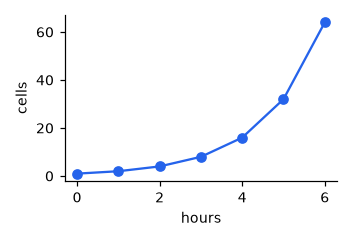
ax.plot(x, y)
a column in order, like time
a culture growing hour by hour
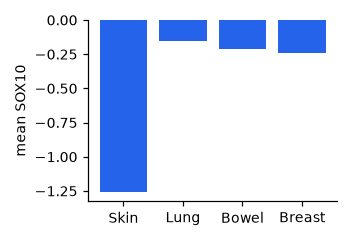
ax.bar(names, heights)
one number per category
mean SOX10 in four cancer types
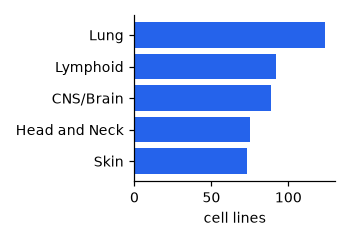
ax.barh(names, widths)
the same, with long names
cell lines per cancer type
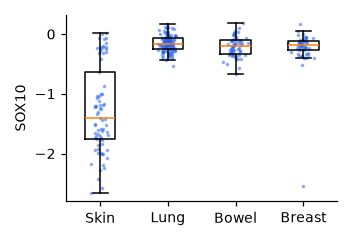
ax.boxplot(groups)
a continuous column, split by category
SOX10 in four cancer types, every line a dot
Many more on the same page: matplotlib.org/stable/api/axes_api.html
Make it, put data on it, label it.
import matplotlib.pyplot as plt
fig, ax = plt.subplots()
ax.hist(df["SOX10"], bins=40)
ax.set_xlabel("SOX10 gene effect")What does plt.subplots() hand you?
fig is the data, ax is the axis labelsfig is the whole figure, ax is one panel you draw ontwo separate figuresa finished plot, ready to showGive the panel a title.
plt.set_title("Growth")fig.set_title("Growth")ax.set_title("Growth")ax.title("Growth")The histogram hides the tail.
fig.set_size_inches(12, 6)ax.set_xlim(-3, 0.5)ax.hist(df["SOX10"], bins=80)ax.set_title("SOX10, in detail")One figure rarely tells the whole story. Mark a group, add colour and a legend, split by category, put two panels side by side, and the SOX10 suspects step out of the crowd.
One column is a distribution. Two columns ask a different question: do they move together? One dot per cell line, x against y.
s=6 shrinks the dots and alpha=0.4 makes them see-through — with 1,165 points an opaque blob tells you nothing. Then remove the #s: a second ax.scatter on the same panel draws the skin lines on top, with bigger dots (s=30) in the next colour. 🔍 Clue 2: the cloud in the bottom left is skin cancer, lines that need SOX10 and BRAF.
The same scatter as before, drawn twice: once for everything else, once for skin on top. Two calls to the same ax, and lineage becomes visible without a third axis.
label= goes on the scatter call, and ax.legend() draws whatever has already been labelled. Forget the label and the legend comes up empty — remember that for the quiz.
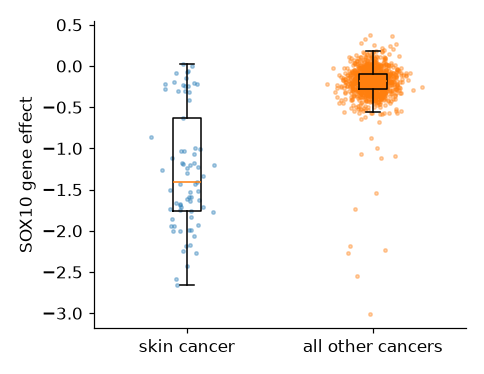
A histogram shows every cell line together. A boxplot splits them into groups and draws each group's spread: the box is the middle half, the line the median, the whiskers the rest.
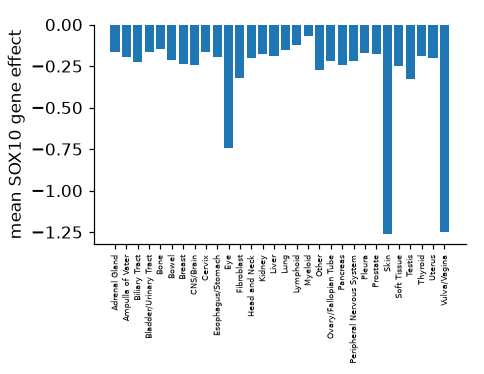
The skin box sits far below the others. But it is also tall: skin is not uniformly dependent, and a mean of −1.26 would hide that.
A box plot with every cell line drawn on top as a dot. The dots are nudged sideways at random so they don't sit on top of each other.
🔍 Clue 3: most skin lines need SOX10 badly, but 18 of 73 hardly need it, and 8 of those are not melanoma at all. A box with dots on top is also exactly the plot your final project asks for.
Ask for two and you get an array of axes back: axes[0] is the left panel, axes[1] the right. Two methods you already know, on two panels.
The long left tail on the histogram is the skin box on the right — neither panel says that alone.
The panels are done; now the fig reception. A title that states the finding, a size that fits the page, spacing that stops labels overlapping, and a file you can put in a report.
dpi=300 is dots per inch: high enough for print. A title that says the result ("Skin cancer lines need SOX10") beats one that names the variables ("SOX10 by lineage").
Groups, legends, panels: the moves that found the SOX10 suspects.
fig, ax = plt.subplots() ax.scatter(rest["BRAF"], rest["SOX10"], color="grey", label="other") ax.scatter(skin["BRAF"], skin["SOX10"], color="blue", label="skin") ax.legend()
One panel, a second group of cell lines.
fig, ax = plt.subplots() ax.scatter(skin["BRAF"], skin["SOX10"], label="skin") # add the lung lines here
fig, ax = plt.subplots()
ax.scatter(lung["BRAF"], lung["SOX10"])ax.scatter(lung["BRAF"], lung["SOX10"], label="lung")fig.scatter(lung["BRAF"], lung["SOX10"], label="lung")ax.scatter(lung["BRAF"], lung["SOX10"], overwrite=False)Count them, then find the last one.
7 panels; axes[3][4]12 panels; axes[2][3]12 panels; axes[3][4]12 panels; axes[4][3]Read the biology off the figure.
SOX10 is mutated in melanoma but not in other cancersSOX10 runs the melanocyte identity programme, and melanoma keeps that programmeOnly skin cells carry the SOX10 geneSkin lines grow fastest, so any knockout hurts them more62 of the 74 melanoma lines need SOX10, whether the melanoma grew in the skin, the eye or elsewhere. Of the other 1,091 cell lines, only 31 do.
Why? SOX10 is the switch that makes a pigment cell (a melanocyte) a pigment cell. Melanoma is a cancer of melanocytes, and it still depends on the switch that made it. Each clue was one figure.
Everything from today comes back: pandas to pick out the groups, a box plot with the points on top to show them, and next week's statistics to say whether the difference is real.
The brief, your data files, the dates and the submission are all on Canvas.
One gene, one question, five figures: that is how you will work in your project too. Next week: is a difference real, or could it be chance? Statistics.